

Thursday, March 26, 2026 will be remembered as one of the worst days for U.S. financial markets since the war with Iran began, and crypto didn’t escape.
This wasn’t a normal pullback. It was a collision of three separate shocks hitting at exactly the same moment: an oil spike, a Big Tech legal crisis, and a complete breakdown of safe-haven rotation. When those three forces align, markets don’t just dip. They reprice.
Here’s exactly what happened, why it matters, and what to watch next.
How Bad Was the Selloff?
The numbers were severe across every major index.
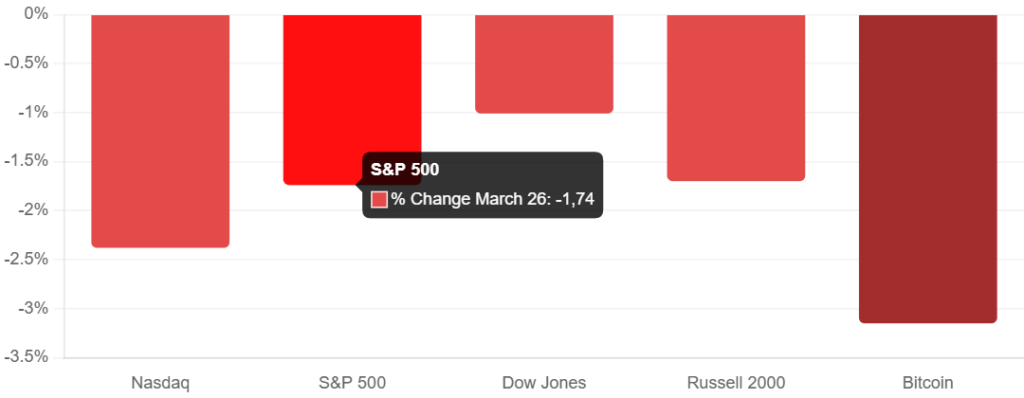
The S&P 500 fell 1.74% to 6,477.16, the Nasdaq Composite sank 2.38% to 21,408.08, and the Dow Jones Industrial Average lost 1.01%, dropping 469 points to 45,960.11, as surging oil prices and Iran-war tensions drove broad risk-off selling. The Nasdaq is now officially in correction territory down more than 10% from its October 2025 record high.
This wasn’t panic yet. But it was a clear and decisive shift in market sentiment.
What Actually Caused the Crash?
Three separate shocks collided simultaneously. Understanding each one matters, because they interact with each other in dangerous ways.
Shock 1: The Oil Spike (The Real Trigger)
Brent crude futures jumped 5.66% to settle at $108.01 per barrel, while West Texas Intermediate futures climbed 4.61% to end at $94.48. As stocks took a leg lower and oil prices received a boost, yields on both the 10-year and 2-year Treasury spiked.
The trigger was geopolitical. After briefly trimming losses when Iran reiterated its terms for a deal, the S&P 500 fell further as President Trump said he wouldn’t commit to an agreement.
Trump’s five-day pause on strikes against Iranian energy infrastructure was set to expire Saturday, and a dramatic military escalation looked increasingly likely if no progress was made in diplomatic talks, particularly if the Strait of Hormuz remained closed.
Why does oil matter so much? Because high oil prices don’t just hurt energy consumers, they raise inflation expectations, which makes it harder for the Federal Reserve to cut interest rates, which keeps pressure on every risk asset from stocks to crypto. ECB President Christine Lagarde warned that equity markets were “too optimistic” amid the “real shock” taking place in Iran, and said it could take years to restore the economic damage.
For more on how inflation directly impacts crypto prices, see our breakdown: How CPI Data Moves Bitcoin — March 2026.
Shock 2: Big Tech’s “Big Tobacco Moment”
Meta Platforms and Alphabet tumbled after a high-profile court case ruling found the firms negligent in a lawsuit about the damages caused by social media addiction. Both companies plan to appeal.
Investors were significantly more concerned about the ruling’s extensive ramifications for Big Tech companies and the future of their business models than they were about the immediate cash losses. On the announcement, Meta dropped about 8%.
This is being described as Big Tech’s “Big Tobacco moment”, not because of the damages themselves, but because of what it implies for future product liability. Infinite scroll, algorithm-driven feeds, autoplay, these design choices are now legally exposed. That opens the door to thousands of similar lawsuits across the industry.
Semiconductors were also particularly hard hit, with Micron dropping 6.9% and Advanced Micro Devices falling 7.5%, while Nvidia shed 4.2%.
Because tech dominates index weightings, when it falls hard, everything else follows.
Shock 3: No Safe Haven Anywhere
This is the detail that separates a normal bad day from something more structurally concerning.
When stocks fall in normal conditions, capital rotates, into bonds, into gold, into defensive assets. On March 26, that rotation largely didn’t happen. Bonds sold off alongside equities as Treasury yields spiked. Gold dropped sharply. The VIX fear gauge surged past 28.
The VIX recently closed above 29, a level that has historically correlated with big gains in the S&P 500 over the next year, but in the short term, it signals the market is pricing in severe uncertainty.
When nothing acts as a safe haven, it signals a liquidity event, capital being pulled broadly, not rotated. That’s a harder environment to navigate.
Winners vs. Losers: The Rotation That Is Happening
Not everything fell. The market is actively repricing based on the new environment, which tells you something important about where the money is going.
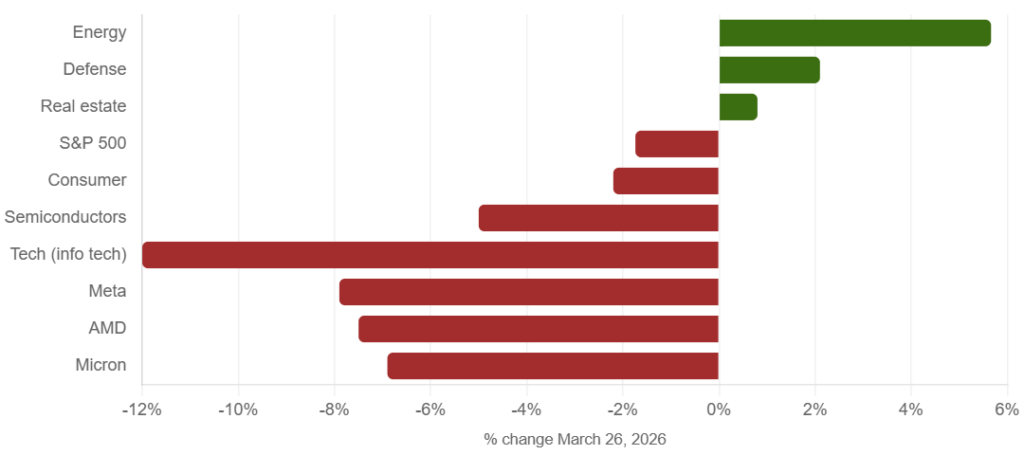
The chart above makes the story clear: energy and defense are the only beneficiaries of the current environment. Everything else, especially tech and semiconductors, is being punished. The information technology sector is now 12% below its high, as investors are concerned that AI spending may be unsustainable.
This is not a random crash. It’s a deliberate repricing of risk based on the new geopolitical and inflationary reality.
Crypto Didn’t Escape — And It’s Moving Faster Than Stocks
Bitcoin is trading around $69,500 as of March 26, 2026, representing a 44% decline from its 52-week high of $126,079 and sitting just 15% above its 52-week low of $60,255.
The Crypto Fear and Greed Index currently reads just 10, with the market enduring 46 consecutive days of extreme fear, the longest such streak since the FTX collapse.
This confirms something we’ve been tracking closely in our weekly crypto summary for March 2026: crypto is not acting as an independent asset right now. It’s moving with, and amplifying, stock market moves.
The Bitcoin-to-S&P 500 correlation has risen to approximately 0.78, meaning they are moving almost in lockstep. As of March 1, the 30-day rolling correlation between Bitcoin and the S&P 500 stood at 0.55, up from around 0.50 in October 2025, and that number has climbed further since.
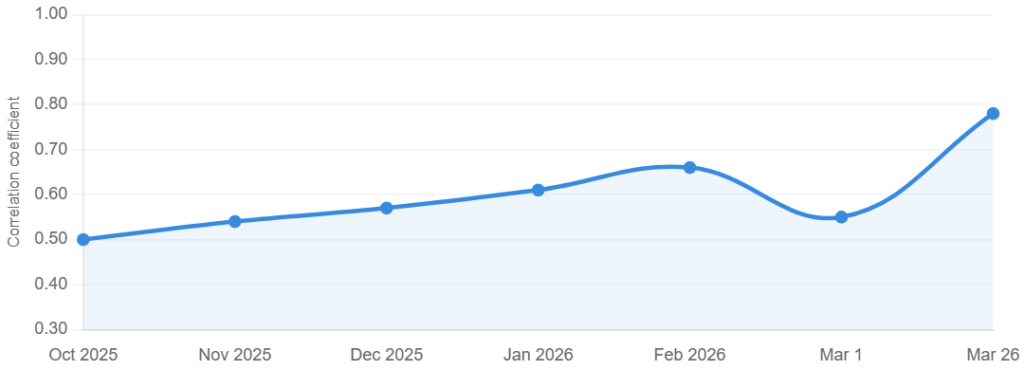
The rising correlation shown above is the single most important thing for crypto investors to understand right now. Bitcoin is not behaving like digital gold. It’s behaving like a high-beta tech stock.
Why Crypto Falls Harder Than Stocks
If Bitcoin is supposed to be a “store of value,” why does a 1.74% drop in the S&P 500 translate to a 3%+ drop in Bitcoin?
Three structural reasons:
Leverage. The crypto derivatives market is enormous. When sentiment shifts, forced liquidations cascade through the system. While $341.96 million in long positions were liquidated in just 24 hours, a hallmark of retail capitulation, the price impact far exceeds what the selling alone would suggest.
24/7 trading. Crypto never closes. When bad news hits after hours or on weekends, crypto absorbs the full shock immediately rather than spreading it over a trading session.
Retail concentration. A red monthly close would mark six consecutive months in the red for Bitcoin, potentially matching the longest negative streak on record, last seen between August 2018 and January 2019. Retail investors tend to panic sell in these environments, amplifying moves downward.
The “Oil vs. Rates” Trap Crypto Is Caught In
Markets are currently stuck in a feedback loop with no clean exit:
Oil rises → inflation expectations rise → rate cut hopes fade → risk assets sell off → crypto follows
The OECD forecast all-items inflation in the U.S. at 4.2% for 2026, a sharp step up from the prior projection of 2.8%, and much higher than the 2.7% Fed officials estimated when they last updated their own forecasts.
Moody’s chief economist Mark Zandi warned that if oil prices remain elevated for much longer, weeks, not months, a recession would be difficult to avoid.
If that scenario plays out, the pressure on risk assets, including crypto, intensifies significantly.
Key Bitcoin Levels to Watch
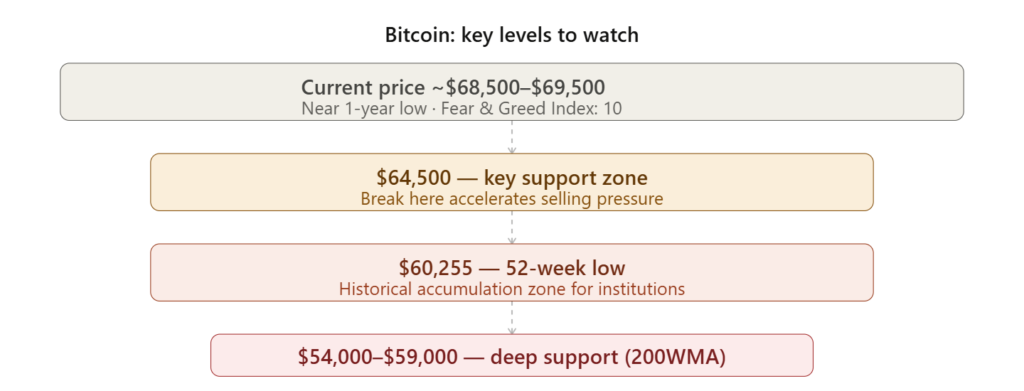
A dense cluster of sell orders sits between $72,300 and $72,600, forming a major resistance zone. Even if Bitcoin attempts a recovery, it may struggle to break through without a surge in demand or volume.
On the downside, Bitcoin continues to hold above its 200-week moving average near $59,000, which has historically acted as strong support during bear markets.
That level is the line in the sand. A sustained close below it would represent a significant structural break.
There is, however, a contrarian signal worth noting. According to Glassnode data, purchasing Bitcoin when the Fear and Greed Index falls below 15 has historically delivered a median 90-day return of +38.4%. Whale wallets holding over 1,000 BTC have reached a record 2,140 addresses, suggesting the market’s largest and most sophisticated participants are treating the current extreme fear as a buying opportunity.
Smart money accumulates during retail panic. Whether this is the bottom or just a pause on the way lower depends on what happens with oil and diplomacy in the next few weeks.
What to Watch in the Days Ahead
The variables that will determine crypto’s next move are almost entirely macro:
Iran ceasefire progress. Any credible de-escalation would immediately reduce oil prices and ease inflation fears. This is the single biggest positive catalyst available right now.
Fed communication. Any sign that the Fed would tolerate higher inflation or delay hikes to support a slowing economy would be read as bullish for risk assets.
S&P 500 support at 6,175. The next support level for the S&P 500 is around 6,175, which would take the index back to levels not seen since July. A breakdown in semiconductor stocks, particularly Micron and the SMH ETF, could be the driver of the next leg lower. If that breaks, Bitcoin’s $60,000 floor gets tested quickly.
ETF outflows. February marked the fourth consecutive month of net outflows from spot Bitcoin ETFs, but the trend is shifting sharply from $3.48 billion in outflows in November 2025 down to just $206.52 million in February 2026, a 94% reduction.
If institutional flows turn positive again, that’s a significant change in the backdrop.
You can track the latest developments in our weekly crypto market summary.
The Bottom Line
March 26 wasn’t just a bad day. It was a signal.
Three separate shocks:
1. Oil above $108
2. Big Tech’s biggest legal crisis in years
3. And a complete failure of safe-haven rotation
This collided in one session and confirmed what our inflation analysis has been pointing to for weeks: crypto is fully tied into the global financial system now, and it amplifies macro moves rather than hedging against them.
The “Bitcoin as digital gold” thesis is being stress-tested, and right now, it’s not passing.
But history cuts both ways. The same conditions that create these drops of fear, forced selling, and extreme negative sentiment, are precisely what precede the most powerful rallies. Wall Street’s bottom-up consensus forecast implies the S&P 500 could reach 8,338 by March 2027, nearly 27% above current levels. If that materialises, Bitcoin almost certainly leads the move.
The question isn’t whether it recovers. The question is how much lower it goes before it does.