

The cryptocurrency market is entering the week of March 16 with renewed momentum as Bitcoin climbs back toward the $74,000 level, triggering a strong relief rally after weeks of uncertainty.
Bitcoin is currently trading near $73,882, marking a 4.2% weekly gain, even as traditional markets like the S&P 500 remain under pressure. According to market intelligence reports, this divergence suggests crypto is temporarily decoupling from equities as investors search for alternative assets during geopolitical and macroeconomic uncertainty.
One major reason for this shift is that Bitcoin is increasingly being viewed as a partial hedge against geopolitical instability, similar to gold.
For readers looking for a deeper explanation of this trend, see our analysis on why crypto is diverging from traditional markets:
But the current rally is not only about macro narratives. The real drivers behind the market this week include institutional buying, liquidity dynamics, derivatives positioning, and the upcoming Federal Reserve decision.
The Key Event This Week: The FOMC Meeting
The biggest catalyst for crypto markets this week is the Federal Reserve’s FOMC meeting scheduled for March 17–18.
Investors expect the Fed to keep interest rates unchanged between 3.5% and 3.75%, but the tone of Jerome Powell’s press conference could significantly influence market direction.
Two scenarios dominate current market expectations.
If the Fed signals that interest rate cuts could arrive later this year, global liquidity conditions could improve, potentially allowing Bitcoin to break above the $74,000 resistance zone and target the $80,000 level.
However, if Powell maintains a hawkish tone due to persistent inflation risks, traders may take profits and push Bitcoin back toward the $70,000 support zone.
Because crypto markets operate around the clock and react quickly to macro shifts, the Fed’s messaging often triggers large volatility spikes across digital assets.
Institutional Buying Is Creating a Strong Market Floor
One of the strongest forces supporting Bitcoin right now is institutional accumulation.
According to Bloomberg, Strategy Inc. (formerly MicroStrategy) recently purchased nearly $1.6 billion worth of Bitcoin, marking its largest acquisition since January.
The company now holds approximately 738,731 BTC, making it the largest corporate holder of Bitcoin.
Large treasury purchases like this create a structural price floor, because institutions typically buy with long-term investment horizons rather than short-term speculation.
At the same time, spot Bitcoin ETFs have experienced their first five-day inflow streak of 2026, bringing total ETF assets to approximately $91.8 billion.
These inflows indicate that institutional investors continue to accumulate Bitcoin even during periods of market uncertainty.
Liquidity Heatmap Shows Potential Short Squeeze
Current liquidity conditions suggest the market may be approaching a short squeeze scenario.
As Bitcoin climbed above $73,000, many bearish traders who had shorted the market were forced to close their positions.
Liquidation Clusters
Data from derivatives markets shows a massive cluster of short liquidations between:
$74,200 and $75,500
If Bitcoin breaks above $74,100, this could trigger a cascading squeeze where short sellers are forced to buy Bitcoin back rapidly.
That buying pressure could quickly push prices toward $80,000.
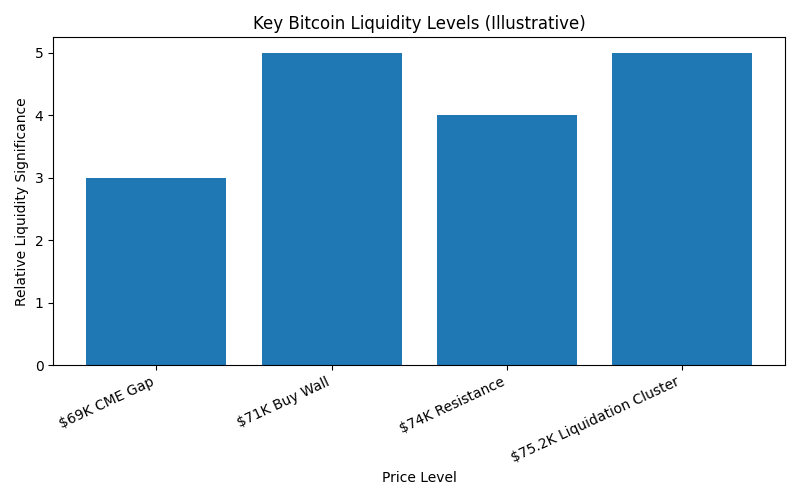
Figure 1 — Major Bitcoin liquidity zones and liquidation levels that could drive volatility this week.
As shown in Figure 1, Bitcoin futures open interest has steadily climbed toward $38 billion, indicating that a growing amount of leveraged capital is entering the market and increasing the potential for large volatility swings.
Key Support Zones and Order Book Liquidity
On the downside, large buy orders are sitting near $70,500, creating a potential support floor.
This area contains both:
- institutional limit orders
- algorithmic trading liquidity
Another notable factor is that sell-side liquidity above $74,000 has thinned out on major exchanges like Binance and Coinbase.
This means less capital is required to move the price higher, which increases the probability of sudden upward spikes.
Stablecoin Liquidity Indicates Capital Waiting on the Sidelines
Another important metric is the Stablecoin Supply Ratio (SSR).
The SSR currently remains relatively low, which means investors are holding large amounts of stablecoins such as USDT and USDC rather than deploying them into crypto.
In simple terms, this represents “dry powder” waiting to enter the market.
Many traders are likely waiting for clarity from the Federal Reserve decision before committing new capital.
Combined stablecoin market caps remain above $300 billion, but growth has plateaued, suggesting that new investors are entering the market more slowly than during previous bull cycles.
Derivatives Markets Show Rising Speculation
While the spot market looks healthy, the derivatives market is beginning to show signs of overheating.
Funding Rates
Funding rates across major exchanges such as Binance and Bybit have turned strongly positive.
This means traders holding long positions are paying extra fees to keep those positions open.
When funding rates become elevated, it often indicates retail traders are entering the market aggressively, which can sometimes precede volatility.
Open Interest
Bitcoin’s total open interest has climbed to approximately $38 billion.
Rising open interest combined with rising prices usually signals increasing market participation, which is bullish.
However, high leverage also increases the risk of rapid liquidations if prices suddenly drop.
Ethereum derivatives activity has also surged, with ETH open interest rising 9.4% in the past 24 hours, confirming that new speculative capital is entering the market.
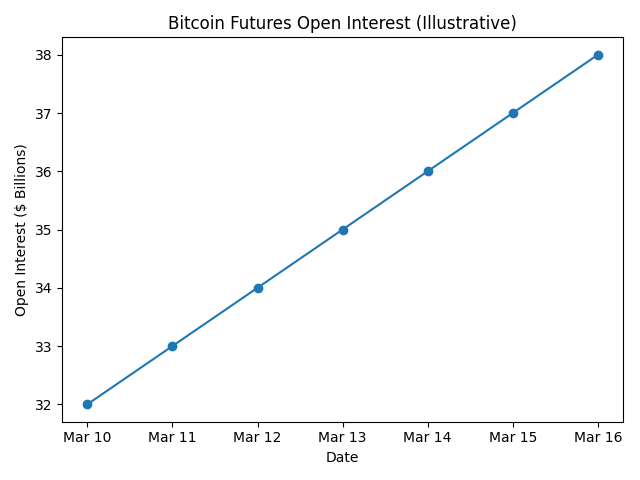
Figure 2 — Bitcoin futures open interest approaching $38B, indicating rising leverage ahead of the FOMC decision.
As shown in Figure 2, Bitcoin futures open interest has steadily climbed toward $38 billion, signaling that more leveraged capital is entering the market and increasing the likelihood of larger price swings.
Options Market Positioning
Options traders are also positioning for significant volatility this week.
The Put/Call ratio currently sits at 0.62, indicating traders are placing more bullish bets than bearish ones.
The largest concentration of call options sits at the $75,000 and $80,000 strike prices.
However, the Max Pain level for Friday’s options expiry sits near $69,000, meaning market makers may attempt to push prices closer to that level.
Implied volatility has also risen sharply ahead of the FOMC decision, indicating traders expect large price swings.
Macro Liquidity Remains the Silent Driver
Beyond crypto-specific dynamics, global liquidity continues to influence the market.
Bitcoin historically shows a 93% correlation with global liquidity cycles, meaning changes in monetary policy and government spending often affect the price of BTC.
Currently, the U.S. Liquidity Index sits around $5.8 trillion.
Short-term liquidity conditions are improving temporarily because the U.S. is currently in a tax collection “free run” period, meaning fewer funds are being drained from the financial system.
However, broader fiscal support is expected to decline throughout 2026 as governments refinance pandemic-era debt.
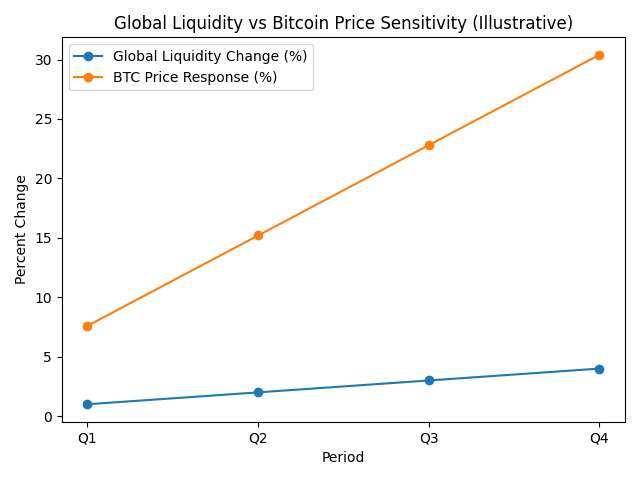
Figure 3 — Bitcoin’s price sensitivity to global liquidity conditions.
As illustrated in Figure 3, Bitcoin historically reacts strongly to changes in global liquidity, meaning even small increases in available capital can produce amplified price movements in the crypto market.
The Treasury Liquidity Effect
Another key variable is the U.S. Treasury General Account (TGA).
The government is aiming to maintain the TGA near $850 billion by the end of March.
When the Treasury rebuilds this account, it effectively pulls money out of the private sector, reducing liquidity available for risk assets like stocks and crypto.
The Yen Carry Trade Risk
Another macro factor impacting markets is the Bank of Japan’s recent interest rate hike to 0.75%, the highest level in more than 30 years.
This has triggered an unwinding of the yen carry trade, where investors previously borrowed cheap yen to buy risk assets like Bitcoin.
As those positions unwind, investors sometimes sell crypto to repay yen-denominated loans.
Key Market Levels
| Price Level | Type | Significance |
|---|---|---|
| $75,200 | Liquidation Cluster | Could trigger rapid upside move |
| $71,000 | Institutional Buy Wall | Major support |
| $69,200 | CME Gap | Potential downside target |
The CME Bitcoin Futures market currently has a price gap near $69,000, which historically tends to get filled at some point.
However, strong bullish momentum may delay that move.
Major Token Unlock Events This Week
Supply shocks are another factor traders are monitoring.
March is expected to be the largest token unlock month of 2026, with approximately $5.8 billion worth of assets entering circulation.
Key unlocks this week include:
- STBL: $16.9M unlock (March 16)
- ASTER: $56M unlock (March 17)
- LayerZero (ZRO): $45M unlock (March 20)
Large unlocks can increase volatility because early investors gain the ability to sell previously locked tokens.
Regulatory Developments
Regulation remains another important theme shaping crypto markets.
The SEC and CFTC recently signed a memorandum of understanding to coordinate oversight of digital assets.
Meanwhile, lawmakers will discuss digital asset regulation at the DC Blockchain Summit this week.
For a full breakdown of the proposed legislation, read our analysis:
Outlook for the Week
Several major catalysts could drive crypto markets in the coming days.
Bullish scenario
A dovish Federal Reserve combined with continued ETF inflows could push Bitcoin above $74,000, triggering a short squeeze toward $80,000.
Neutral scenario
Bitcoin consolidates between $70,000 and $74,000 while markets wait for clearer macro signals.
Bearish scenario
A hawkish Fed decision combined with derivatives liquidations could push Bitcoin back toward the $69,000 CME gap.
Final Thoughts
Despite macro uncertainty and geopolitical tensions, Bitcoin’s ability to rally while equities decline suggests crypto markets are entering a new phase of macro relevance.
Institutional buying, ETF inflows, and growing geopolitical demand are gradually transforming Bitcoin from a speculative asset into a global liquidity instrument.
For the latest crypto market analysis:
Related Analysis
Crypto Market Weekly Summary: Bitcoin Reclaims $72K
https://dailycoinradar.com/crypto-market-weekly-summary-bitcoin-reclaims-72k-ethereum-leads-rally-as-crypto-outperforms-stocks/
Why Crypto Is Rising While Stocks Are Falling
https://dailycoinradar.com/why-crypto-is-rising-while-stocks-are-falling-march-2026/
Stablecoin Market Hits $314B Record
https://dailycoinradar.com/stablecoin-market-cap-record-usdt-usdc-314b/
3 Comments
Pingback: XRP Overtakes BNB to Become 4th Largest Crypto as Price Breakout, ETF Inflows and Ripple Expansion Drive Rally – Dailycoinradar
Pingback: Crypto Liquidity, Market Positioning and ETF Flows (March 2026): Why Thin Liquidity Is Driving Volatility – Dailycoinradar
Pingback: Bitcoin Structural Breakdown (16th March 2026): Liquidity, Institutional Control and Key Price Levels Explained – Dailycoinradar