

The crypto market ended the week of March 6, 2026 with a sharp reversal after a powerful mid-week rally failed to hold. Bitcoin briefly surged to $74,000 before macroeconomic pressure, geopolitical risk, and institutional outflows pushed prices lower into the weekly close. The market’s behavior confirms a key reality dominating this cycle: crypto is currently trading as a liquidity asset, not purely as digital gold.
Crypto Market Snapshot: March 6, 2026
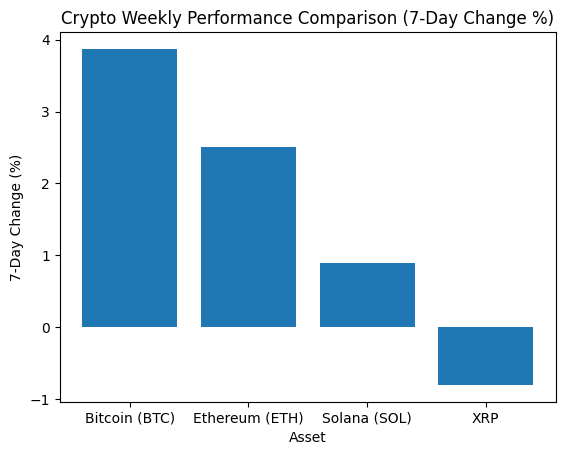
By Friday afternoon, the market had erased most of the gains from earlier in the week.
- Bitcoin (BTC): ~$68,131, down 4.4% in the last 24 hours, but still up ~3.9% for the week
- Ethereum (ETH): ~$1,977, falling below the $2,000 psychological level
- Solana (SOL): ~$87.69, down roughly 4% daily
- XRP: ~$1.42, underperforming the broader market
Investor sentiment deteriorated quickly. The Fear & Greed Index dropped to 14 (Extreme Fear), signaling fragile positioning across crypto markets.
This week ultimately produced what traders call a “round-trip rally” a sharp move higher followed by an equally aggressive reversal.
The $74K Bull Trap: Liquidity Fueled the Rally
Bitcoin’s rally from $64,000 to $74,000 earlier this week was primarily driven by liquidity dynamics rather than structural demand.
Over a three-day period, $1.14 billion flowed into spot Bitcoin ETFs, while derivatives markets saw over $500 million in short liquidations. This combination created a powerful short squeeze that forced bearish traders to buy back positions.
However, the rally stalled exactly where large resistance sat.
$74,000 acted as a major supply wall, triggering aggressive profit-taking.
Once momentum faded, the market quickly reversed.
As discussed in our previous analysis on the potential bull trap scenario, liquidity-driven rallies can reverse quickly when institutional positioning shifts.
Macro Shock: Why U.S. Jobs Data Triggered the Sell-Off
The biggest catalyst behind Friday’s sell-off was the February Non-Farm Payrolls report, which showed 92,000 jobs lost instead of the expected job growth.
This unexpected contraction fueled fears of a broader economic slowdown.
According to our earlier macro analysis, the NFP release was always expected to be the primary volatility trigger for the week.
Market interpretation was immediate:
- Weak labor data increases recession risk
- Recession risk increases market volatility
- Risk assets like crypto see rapid capital outflows
As explained in our macro breakdown of this week’s outlook:
https://dailycoinradar.com/bitcoin-weekly-outlook-iran-war-escalation-oil-prices-at-80-and-key-btc-levels-to-watch-this-week/
Bitcoin is currently trading as a liquidity asset tied to real-rate expectations and dollar liquidity conditions, rather than purely as a geopolitical hedge.
Geopolitical Risk: Iran Conflict Continues to Drive Volatility
Another major driver behind the reversal was the escalating conflict in the Middle East.
Earlier in the week, Bitcoin temporarily benefited from the “digital gold” narrative as geopolitical tensions intensified. During the initial escalation, Bitcoin dropped below $64,000, triggering widespread panic selling before rapidly recovering above $73,000.
As explained in our earlier report on the market reaction to the conflict:
https://dailycoinradar.com/bitcoin-bull-trap-or-trend-reversal-btc-surges-above-73k-as-etf-inflows-and-geopolitical-tensions-drive-crypto-market-rally/
Crypto markets initially absorb global shocks because they trade 24/7, often reacting faster than traditional financial markets.
But as the week progressed, the broader macro environment shifted toward a risk-off mood, dragging crypto back down alongside equities.
Institutional Liquidity Is Becoming the Market’s Structural Floor
Despite the late-week sell-off, institutional flows continue to shape market structure.
Earlier in the week, ETF inflows acted as a strong support mechanism. However, sentiment shifted quickly.
According to market data, spot Bitcoin ETFs recorded a $227.9 million net outflow on March 5, signaling institutional caution.
Institutional liquidity has become the most important stabilizing force in crypto markets.
As previously discussed in our institutional flow analysis:
Over $1.7 billion flowed into spot Bitcoin ETFs during the rebound, showing that large investors aggressively bought the dip created by geopolitical fear.
However, institutional demand does not automatically create a sustained uptrend. When liquidity slows, the market quickly loses momentum.
Why Was XRP the Only Major Asset Negative This Week?
XRP Underperformed After Failing to Break Key Resistance
While Bitcoin and Ethereum managed to maintain positive weekly performance, XRP ended the week slightly negative.
According to CoinDesk, XRP’s underperformance began after repeated failures to break the $1.43–$1.45 resistance zone.
Once that level rejected the rally, trading volume surged 74% during the sell-off, signaling that sellers regained short-term control of the market.
Additional pressure came from slowing institutional demand.
According to Bitget, inflows into XRP investment products slowed significantly in early 2026, removing a key support layer that previously helped stabilize the asset.
On-chain data also suggests long-term holders have been distributing holdings, using short rallies as exit liquidity after XRP’s extended downtrend.
This created persistent selling pressure that kept XRP from joining the broader market rebound.
Regulatory and Industry Developments
Despite the volatility, several important structural developments occurred this week.
Stablecoin Regulation Advances
Florida became the first U.S. state to pass a comprehensive stablecoin bill, while the Office of the Comptroller of the Currency proposed a national supervisory framework for payment stablecoins under the GENIUS Act.
You can read our full breakdown of the legislation here:
https://dailycoinradar.com/digital-asset-market-clarity-act-2025-vs-2026-key-differences-between-the-house-and-senate-bills-and-their-impact-on-crypto/
Institutional Adoption Continues
Traditional financial institutions are accelerating crypto integration.
- Morgan Stanley applied for a trust bank license to provide crypto custody and staking services
- SoFi Bank began supporting Solana deposits
Meanwhile, the SEC issued a “no-action” letter for the Depository Trust & Clearing Corporation tokenization pilot, clearing a path for tokenized real-world assets to move on-chain.
These developments reinforce the long-term trend of institutional infrastructure building around digital assets.
Base Case Scenario: Liquidity Range Into Next Week
The most likely short-term outcome is continued range-bound volatility driven by macro liquidity conditions.
Bitcoin currently sits between two critical structural levels:
- $74,000 resistance
- $64,000 liquidity support
Unless macro conditions improve significantly, markets are likely to remain trapped between those levels.
The Signal to Watch Next Week
The single most important indicator going forward is institutional liquidity flow, particularly:
- Daily Bitcoin ETF inflows/outflows
- U.S. dollar liquidity conditions
- Energy prices linked to Middle East tensions
If ETF inflows resume and geopolitical tensions stabilize, Bitcoin could attempt another push toward $74K resistance.
If outflows continue while macro pressure intensifies, the market could revisit the $64K liquidity floor.