
")
This week wasn’t just volatile, it was structured.
The crypto market started with a brief sense of relief as geopolitical tensions showed signs of easing. By Friday, that stability had completely reversed. The week ended with Bitcoin at a three-week low, over 122,000 traders liquidated, and sentiment in extreme fear territory for the 46th consecutive day.
But underneath the chaos, there was a clear mechanical logic. Understanding it is what separates emotional reactions from informed positioning.
Weekly Snapshot: Where Every Major Asset Ended Up
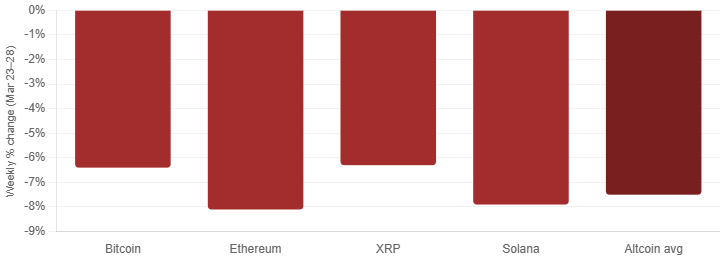
Bitcoin, XRP, Ethereum, and Solana all dropped 6–8% in the week, with the crypto market shedding over $80 billion in total value since March 24. The average crypto RSI dropped to 39, oversold territory not seen since early February’s crash.
Ethereum broke below $2,000 for the first time since mid-2024, putting it 60% below its August 2025 high of $4,953. Bitcoin dropped from $71,000 at the start of the week to $66,457, marking its lowest level since early March and leaving it 47% below its October 2025 all-time high of $126,080.
Monday to Wednesday: A False Dawn
Bitcoin briefly reclaimed $70,000 at the start of the week, driven by news of a temporary de-escalation in Iran-U.S. diplomatic talks. The market briefly saw relief when ceasefire rumors surfaced, pushing Bitcoin back above $70,000. That move gave the impression the market might stabilize. It didn’t last.
ETF flows told an equally mixed story mid-week. Bitcoin spot ETFs logged a five-day consecutive inflow streak early in March, a promising sign, but flows then reversed sharply as macro conditions deteriorated. By March 20, three consecutive days of outflows had already wiped much of the momentum.
The week was building toward an event that would force everything to a head.
The $14 Billion Event That Moved the Market
The biggest driver of the week wasn’t a news headline. It was derivatives.
On Friday, March 27, Deribit settled Bitcoin options worth $14.16 billion, the largest quarterly expiry of 2026, wiping out nearly 40% of all open positions on the exchange.
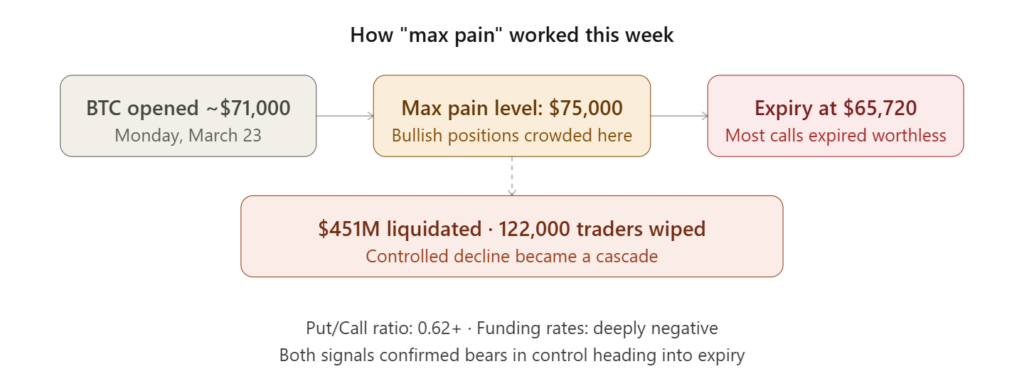
Here’s how the mechanics worked. The “max pain” level for this expiry sat at $75,000 — the price at which the greatest number of option contracts would expire worthless, causing the maximum loss for buyers. Deribit’s Chief Commercial Officer Jean-David Péquignot confirmed: “With Bitcoin currently trading near $71k, the $75k max pain price represents a gravitational pull. Historically, this encourages delta-hedging by market makers that can drive prices toward the strike where the most options expire worthless.”
The problem: Bitcoin never reached $75,000. Instead, as the $14 billion in options expired on Deribit, Bitcoin fell 5% in 24 hours to as low as $65,720 on March 27. The expiry triggered over $451 million in liquidations, wiping out more than 122,000 traders.
Once Bitcoin broke the key $67,500 level, forced selling by leveraged longs compounded the move. A controlled decline became a cascade.
Macro Headwinds Were Building All Week
The options expiry didn’t happen in isolation. Three macro pressures were stacking against the market simultaneously.
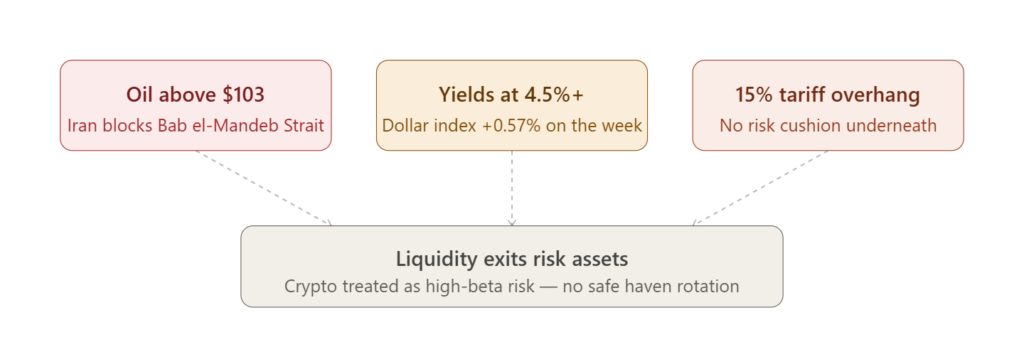
Iran threatened to block the Bab el-Mandeb Strait which is the Red Sea gateway that carries 12% of global seaborne oil, on top of the Strait of Hormuz, which has been effectively closed since late February. Oil pushed above $103, and the gold-to-crypto rotation that had been helping Bitcoin recover earlier in March reversed completely.
The 10-year Treasury yield is now near 4.5%, and the dollar index climbed 0.57% in a week. When yields rise and the dollar strengthens, money moves out of crypto and into bonds. The 15% global tariff overhang that’s been keeping investors away from risk assets since early 2026 hadn’t gone anywhere either, so when the options expired and the Iran escalation hit, there was no cushion underneath.
This is the “oil vs. rates” trap we analyzed in depth in our inflation and Bitcoin piece: when oil rises, inflation expectations rise, rate cut hopes fade, and pressure on every risk asset, including crypto intensifies.
XRP: A Classic “Sell the News” Setup
XRP’s weekly performance is worth analyzing on its own, because it illustrates a pattern that repeats throughout crypto markets.
Heading into the week, expectations were high. The upcoming SEC decisions on additional crypto ETF applications, including spot XRP products with a March 27 deadline, could influence broader sentiment toward the regulated crypto product category.
When no clear SEC decision materialized by Friday, crowded bullish positioning unwound fast. XRP dropped over 6% for the week, with the sharpest decline coinciding with the broader Friday selloff. This is a textbook “sell the news” pattern: anticipation builds, positioning becomes crowded, the catalyst disappoints or fails to arrive, and the exit rush is sharp.
XRP tested the $1.35 support level multiple times through March, with buyers stepping in each time, but that support is now being watched closely heading into April.
Institutional Flows: The Most Important Signal of the Week
March 26 was the first day in 2026 where Bitcoin, Ethereum, and Solana spot ETFs all posted net outflows simultaneously. That’s a significant milestone — and not a positive one in the short term.
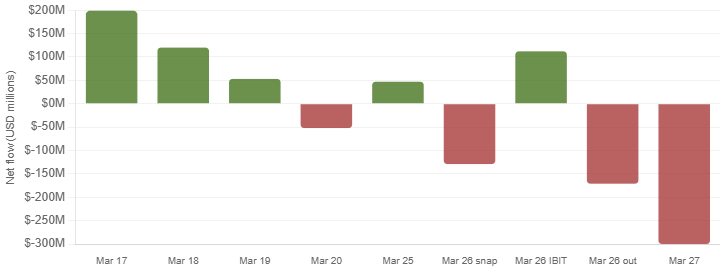
The chart shows the full picture of institutional behavior this month. Bitcoin spot ETFs logged a remarkable first five-day consecutive inflow streak of 2026, accumulating $767M through March 16, with the daily peak on March 17 at $199.37M. Then the FOMC hit, within 48 hours, flows reversed completely.
BlackRock’s iShares Bitcoin Trust (IBIT) led inflows with $112 million on March 25, while Grayscale’s GBTC continued its steady bleed with $58 million in outflows. Ethereum spot ETFs painted a weaker picture, posting their fifth consecutive day of net outflows at $23.1 million.
On March 27, U.S. spot Bitcoin ETFs recorded a net outflow of over 2,000 BTC in a single day. The initial decline triggered a liquidation cascade across leveraged positions, amplifying volatility and accelerating the downside move.
The ETF flow data tells you something important: institutions weren’t adding risk this week. They were reducing it. The reason wasn’t crypto-specific, it was macro. With oil rising and yields increasing, capital rotated toward safer assets. That said, the structural picture remains intact: spot Bitcoin ETFs accumulated $18.7 billion in net inflows during Q1 2026 alone, pushing cumulative lifetime inflows past the $65 billion milestone, with ETFs experiencing less than $10 billion in total outflows despite an aggressive drawdown an 83% capital retention rate.
What Whales Were Actually Doing
While retail traders were being liquidated, large holders were doing the opposite, quietly accumulating.
On-chain data reveals that a single entity executed a 12,500 BTC over-the-counter block trade worth approximately $925 million, with the same wallet cluster accumulating over 38,000 BTC since January 2026. Large whale addresses collectively added 270,000 BTC over the past 30 days, marking the highest monthly accumulation rate since 2013.
Whales accumulated about 61,000 BTC this week alone, while exchange outflows increased and stablecoin inflows rose, dry powder sitting ready to deploy.
Stablecoin supply is sitting near a record $316 billion right now, which tells you that capital hasn’t actually left the crypto ecosystem. When conditions improve, that money can flow back into BTC, ETH, XRP, and SOL.
This divergence between retail behaviour and whale behaviour is the most important signal of the week. It suggests the move was driven by positioning and leverage mechanics, not a collapse in long-term conviction.
Sentiment: 46 Consecutive Days of Extreme Fear
March 28, 2026 marks the 46th consecutive day of extreme fear, the longest unbroken streak since the post-FTX collapse of late 2022. The Fear & Greed Index sits at 8 out of 100.
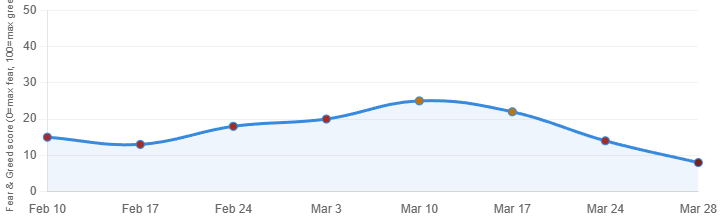
There is a historical signal buried in this data that’s worth paying attention to. According to Glassnode data, purchasing Bitcoin when the Fear & Greed Index falls below 15 has historically delivered a median 90-day return of +38.4%. The current reading of 8, sustained for an unprecedented 46 consecutive sessions, places this cycle firmly inside that historically high-probability accumulation zone.
That doesn’t guarantee anything. The macro landscape of 2026 carries unique risks that previous fear episodes didn’t face. But it does explain why whales are accumulating while retail panic-sells. You can track the live Fear & Greed Index at CoinMarketCap.
The Week in One Framework: A Liquidity Reset
This week was not random. It was three forces colliding simultaneously:
The derivatives pressure from $14.16 billion in options expiring, with max pain at $75,000, roughly $9,000 above where Bitcoin was actually trading. The macro headwinds from oil above $103, Treasury yields at 4.5%, and a rising dollar all compressing risk appetite. And the positioning unwind from crowded long positions, coordinated ETF outflows, and the XRP sell-the-news reversal.
When these three forces hit at once, the result looks like panic. But it’s actually a mechanical liquidity reset. The leveraged positions that built up through March’s recovery have now been cleared. What follows is typically a cleaner, less mechanical market, where the next move is determined by genuine macro catalysts, not derivatives hedging flows.
What to Watch in the Week Ahead
Bitcoin’s $66,000 support. Bitcoin’s $66,000 support is the key level to watch. A daily close below it could trigger a move toward $50,000. That’s the line in the sand. Above $72,000, however, the path higher looks compressed, above that level, little stands in the way before a possible rush toward $82,000.
ETF flows turning positive. If you start seeing ETF inflows turn positive across multiple consecutive days rather than one-off bounces, that’s likely the beginning of a recovery. Watch daily data at The Block’s ETF tracker.
Iran ceasefire progress. A credible ceasefire could push Bitcoin above $75,000, triggering further gains as bearish positions are unwound. Failure in negotiations, however, may drag Bitcoin back toward $68,500 and the rising trend line.
The post-expiry environment. Once the expiry passes, the forces suppressing volatility will recede leaving macroeconomics and geopolitics firmly back in control. The calm in Bitcoin may be more structural than fundamental, and conviction remains weak. With 40% of open interest now cleared from Deribit, the next move is no longer constrained by hedging mechanics.
For DeFi-specific implications of this macro environment, including how protocols are holding up despite the selloff, see our DeFi in 2026 deep-dive.
The Final Take
The key takeaway from this week is straightforward: crypto is no longer moving on its own. It’s fully integrated into the global macro environment and it amplifies every macro shock it encounters.
When liquidity tightens, crypto drops faster. When positioning gets crowded, the unwind is sharper. When volatility spikes, it amplifies it. The $14B expiry, oil above $103, and the Iran escalation didn’t cause the selloff individually. They combined to create conditions where every leveraged position in the system got stress-tested at once.
But the underlying behaviour, especially from large holders and the $316 billion in stablecoin reserves sitting ready to redeploy, suggests this wasn’t an exit. It was a reset.
And resets, historically, are where the next cycle’s foundation gets built.