
: Why Thin Liquidity Is Driving Volatility")
The cryptocurrency market in March 2026 is entering a unique phase where prices are rising, but liquidity remains thin, creating an environment of heightened volatility.
Despite a recovery in sentiment and strong institutional inflows, trading activity remains relatively low, meaning small amounts of capital can move prices significantly.
Current Market Snapshot
- Total crypto market cap: ~$2.53 trillion
- 24-hour trading volume: ~$137.6 billion
- Market sentiment: Fear (Index ~28)
At first glance, the market appears healthy. However, the underlying structure tells a different story.
Liquidity remains concentrated, fragmented, and highly sensitive to macro events, which explains the sharp price movements seen in recent weeks.
Thin Liquidity Is Driving Volatility
One of the most important dynamics right now is the mismatch between:
High institutional inflows
Low spot trading volume
In simple terms:
There is money entering the market but not enough active trading to absorb it smoothly.
This creates:
- faster price moves
- larger swings
- higher sensitivity to news
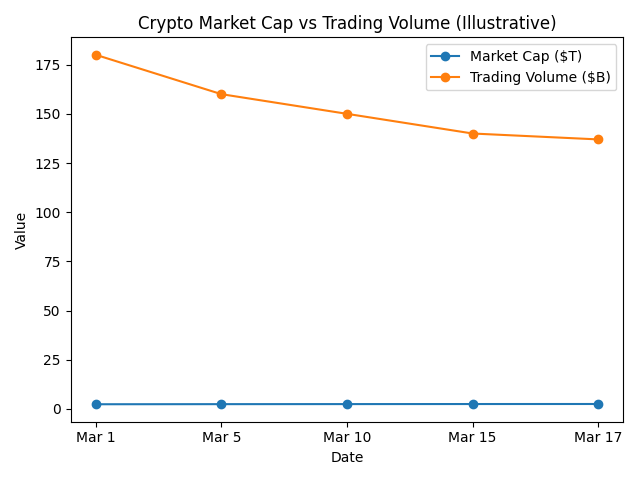
Figure 1 — Crypto market cap rising while trading volume declines, indicating thin liquidity conditions.
As shown in Figure 1, market capitalization continues to rise while trading volume declines, highlighting the liquidity compression driving increased volatility.
Liquidity Is Concentrated in a Few Assets
Liquidity in crypto is not evenly distributed.
Most of it is concentrated in:
- Bitcoin (BTC) — dominant liquidity source (~58% dominance)
- Ethereum (ETH) — core settlement layer for DeFi
- Solana (SOL) — strong recovery and high on-chain activity
Meanwhile, stablecoins act as the foundation of liquidity across the entire market.
Stablecoins: The Market’s Hidden Liquidity Engine
Stablecoins like USDT and USDC represent over $300 billion in total supply, acting as deployable capital waiting to enter the market.
- USDT dominates trading liquidity
- USDC is growing rapidly in institutional usage
This creates a dual system:
- USDT → trading liquidity
- USDC → institutional settlement
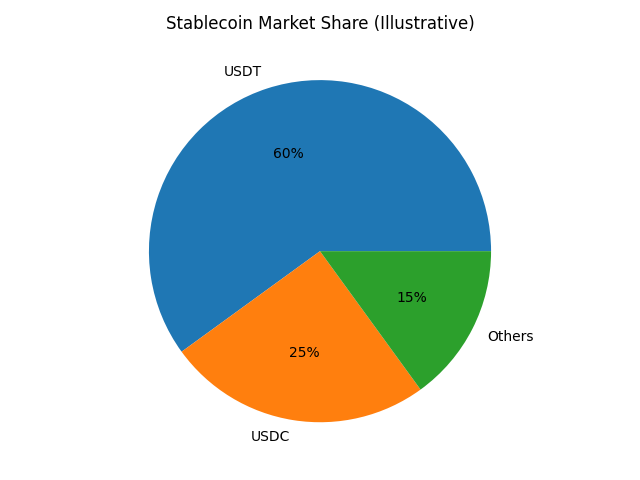
Figure 2 — Stablecoin market share showing USDT dominance and USDC’s growing institutional role.
As illustrated in Figure 2, USDT dominates trading liquidity, while USDC continues gaining share as the preferred stablecoin for institutional use.
Derivatives Now Control the Market
More than 70% of crypto trading volume now comes from derivatives markets, particularly perpetual futures.
This means:
price discovery happens in derivatives first
spot markets follow
As a result, leverage plays a much larger role in price movements than in previous cycles.
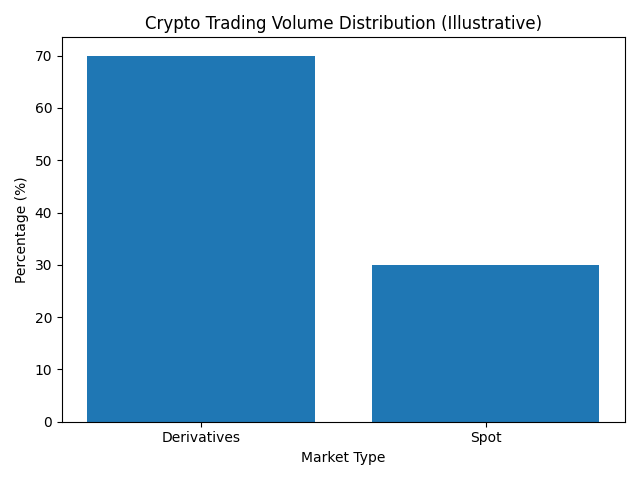
Figure 3 — Derivatives markets dominating crypto trading volume.
As shown in Figure 3, derivatives now account for the majority of trading volume, meaning leverage plays a central role in price discovery.
Institutional Positioning Is Reshaping the Market
Unlike previous cycles driven by retail speculation, the current market is increasingly controlled by institutions.
- Institutions control ~24% of Bitcoin supply
- ETF assets exceed $90 billion
- Corporate treasuries continue accumulating
This creates what analysts call “sticky liquidity” capital that does not exit the market easily.
Bitcoin Is Acting Like Digital Gold
Bitcoin is increasingly behaving like a macro asset.
Despite weakness in equities, BTC has:
- held above $72,000
- gained ~4.2% weekly
- acted as a geopolitical hedge
This supports the narrative that Bitcoin is transitioning toward a store-of-value role similar to gold.
You can get a broader trend where crypto is beginning to decouple from traditional markets.
ETF Flows Are Driving the Market
ETF flows have become one of the strongest catalysts in crypto.
Bitcoin ETFs
- $767M inflows in a recent 5-day streak
- Total AUM: ~$91.8B
- BlackRock IBIT dominates flows (~78%)
Ethereum ETFs
- ~$212M recent inflows
- Staking-enabled ETFs increasing demand
Altcoin ETFs
- XRP, SOL, AVAX seeing consistent inflows
These flows represent long-term capital, not short-term speculation.
Market Positioning: A Structural Shift
The market is undergoing a major transition:
From speculative trading
To institutional infrastructure
Key narratives include:
- Real-world assets (RWA)
- AI-driven economies
- regulated stablecoins
These trends suggest crypto is evolving into a financial system layer, not just an asset class.
Emerging Risks
Despite the positive outlook, several risks remain:
Regulatory Fragmentation
MiCA in Europe is creating liquidity fragmentation across regions.
De-pegging Risk
Thin liquidity increases the chance of stablecoins temporarily losing their $1 peg.
Macro Sensitivity
Interest rates and geopolitical tensions continue to drive liquidity flows.
Outlook
Bullish case
- Bitcoin holds above $74K
- ETF inflows continue
- liquidity expands
Bearish case
- Liquidity tightens
- Macro pressure increases
- BTC drops toward $60K
Final Thoughts
The crypto market in 2026 is no longer driven purely by speculation.
Liquidity, positioning, and institutional flows are now the primary forces shaping price action.
Understanding these dynamics is essential, as thin liquidity combined with large capital inflows creates both opportunity and risk.
For more crypto market analysis and liquidity insights, visit the DailyCoinRadar homepage.
7 Comments
Pingback: Institutional Adoption and Tokenization: Crypto’s Shift Toward Real-World Finance – Dailycoinradar
Pingback: US Jobless Claims Beat Expectations: What Strong Labor Data Means for Bitcoin & Crypto Liquidity – Dailycoinradar
Pingback: Stablecoin Market Surge During Crypto Crash: Why Capital Is Rotating Into USDT and USDC (March 2026) – Dailycoinradar
Pingback: Crypto Market Outlook This Week (March 23–29, 2026): Bitcoin Levels, Altcoin ETF Decision & Key Catalysts – Dailycoinradar
Pingback: Crypto Weekly Summary: Bitcoin Holds $70K as Fed, Iran Tensions and ETF Outflows Drive Market Volatility – Dailycoinradar
Pingback: What Is Bitcoin? The Complete Guide - Dailycoinradar
Pingback: Bitcoin Structural Breakdown — March 2026: Liquidity, Institutional Control and Key Price Levels - Dailycoinradar